top of page

Search


Dynamic EDA for Qatar World Cup Teams
How to Use Plotly for Insightful Data Explorations This article will introduce the tool, Plotly, that brings data visualization and...
Dec 10, 2022


How to Visualize Twitter Trends in 4 Simple Steps
A Swift Approach to Research Twitter Trending Topics in 10 Minutes. Additionally, visualize using WordCloud in just several lines of code.
Jun 6, 2022


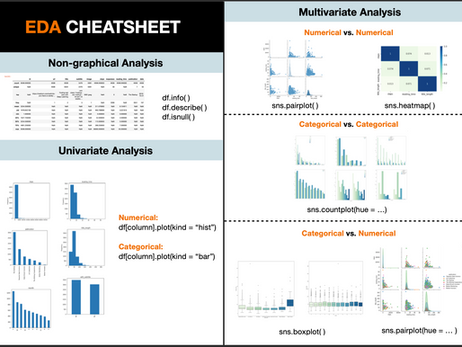
Semi-Automated Exploratory Data Analysis Process in Python
An Exploration on the "Medium" Dataset Using Pandas and Seaborn Exploratory Data Analysis, also known as EDA, has become an increasingly...
Feb 28, 2021


Top 15 Websites for Data Scientists in 2021
Learning data science is a long journey, following a rigid course curriculum inevitably makes learning a mundane task. Therefore, I have com
Jan 17, 2021


How to Learn Data Visualization for Free (Tools + Resources)
Don't let money become the barrier that stops you from learning what you are passionate about.
Oct 19, 2020
Upgrade to Access Code Snippets


bottom of page